Understand the communities impacted by your project
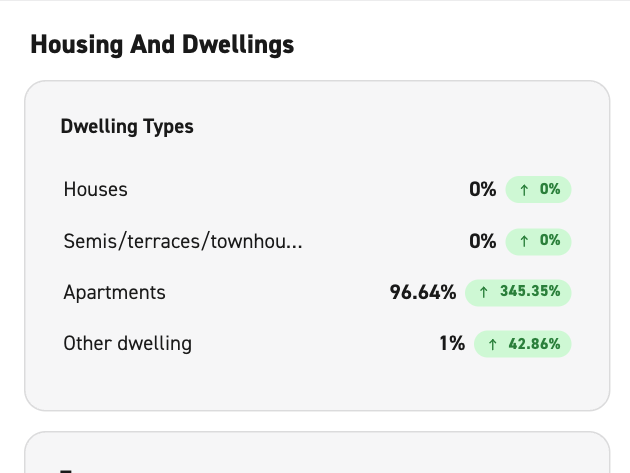
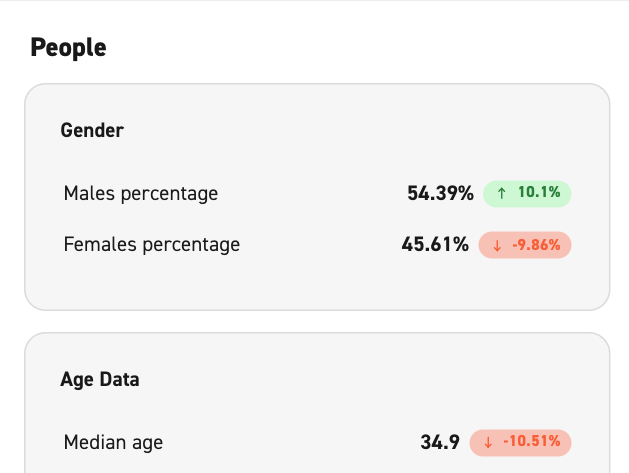
Get community and property data for your exact project area, rather than relying on suburb-level data.
Map your exact project footprint
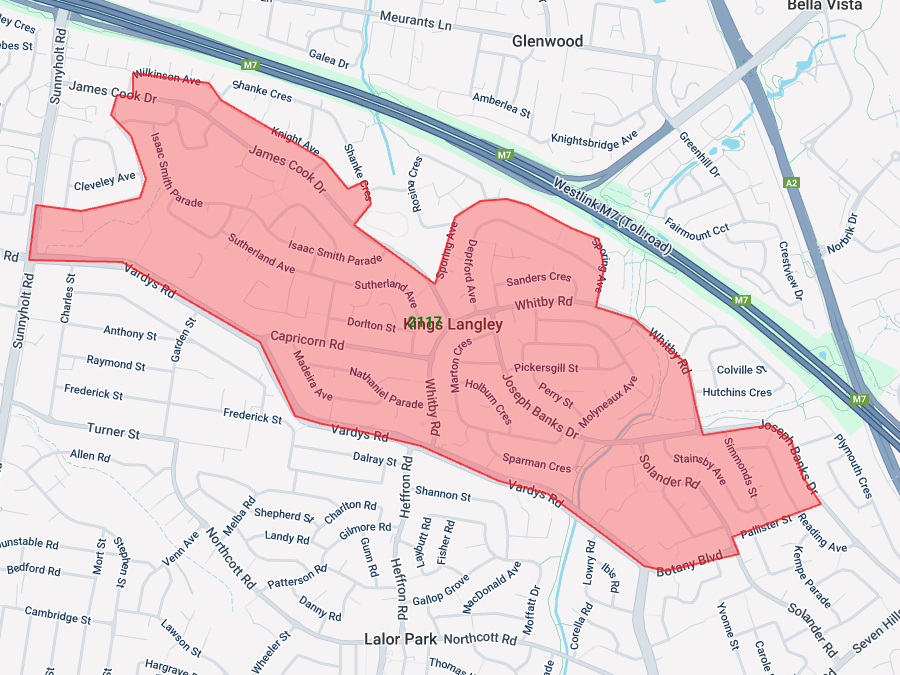
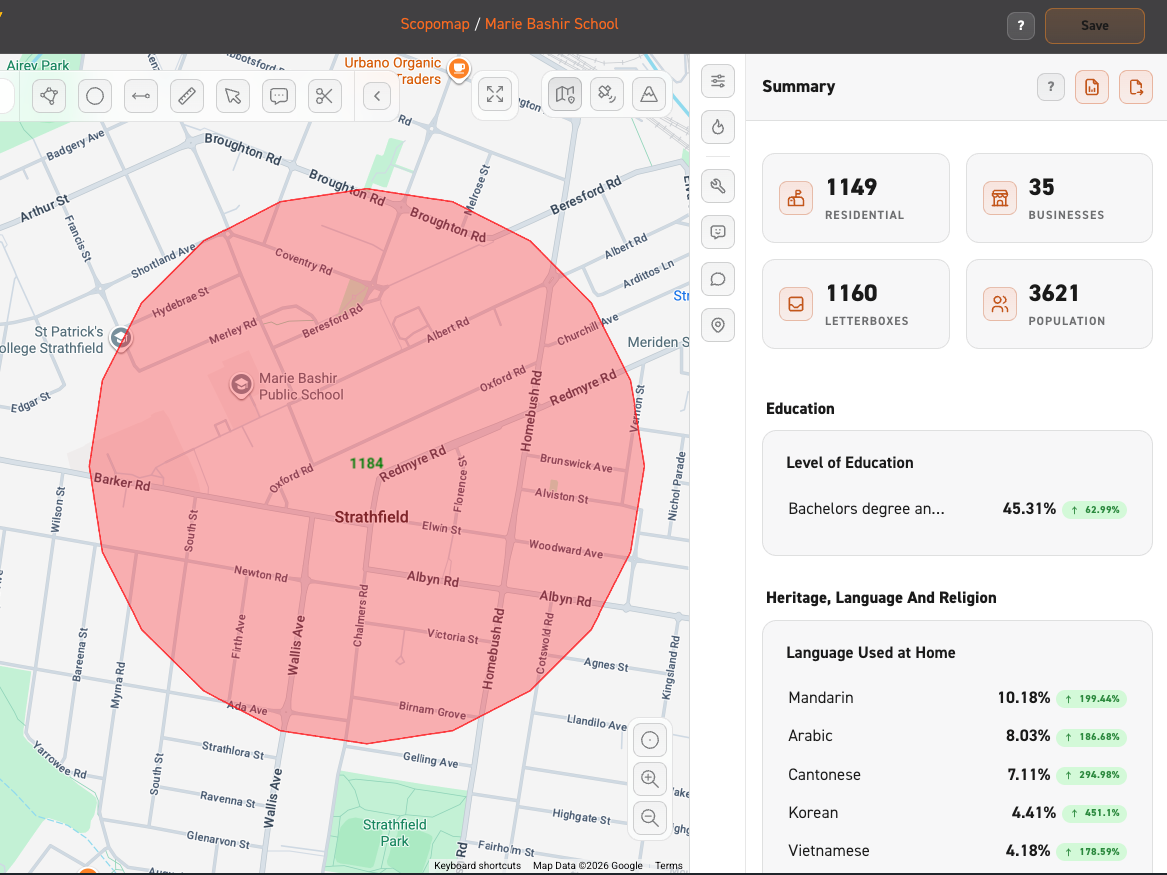
Draw a corridor, radius or custom project area and get demographic and property data for the area within it.
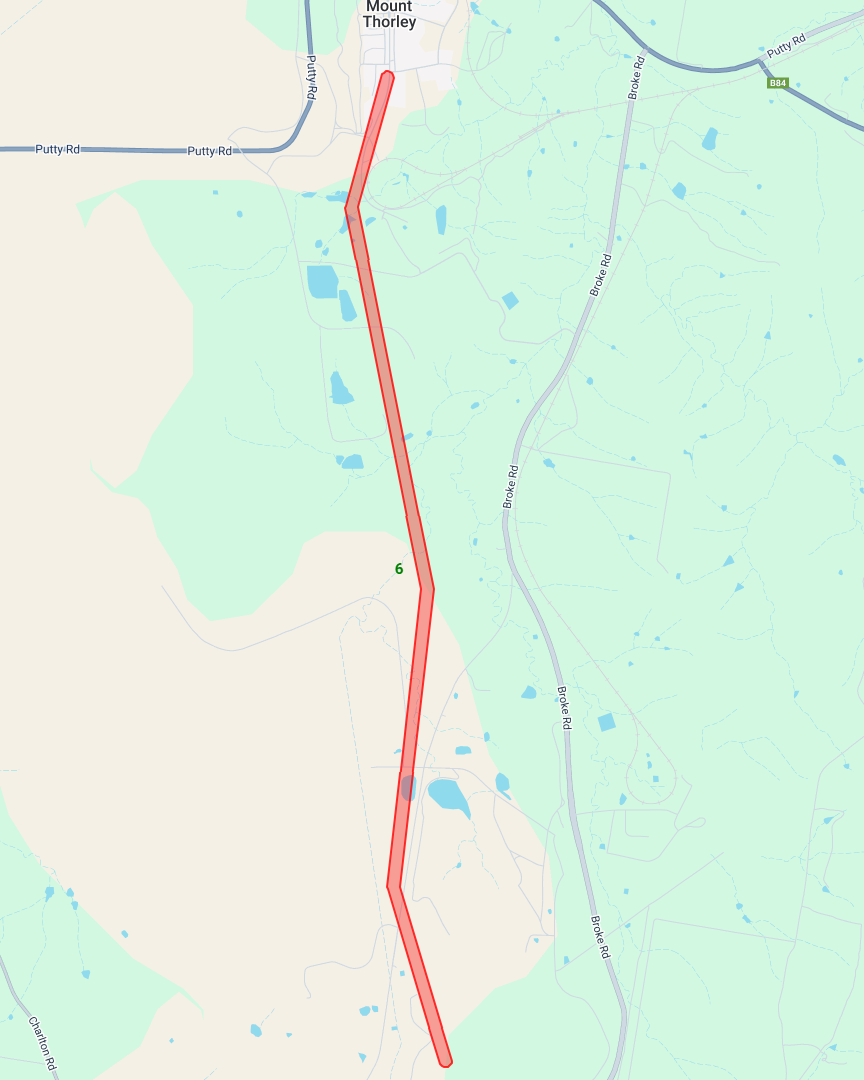
Understand communities along a corridor
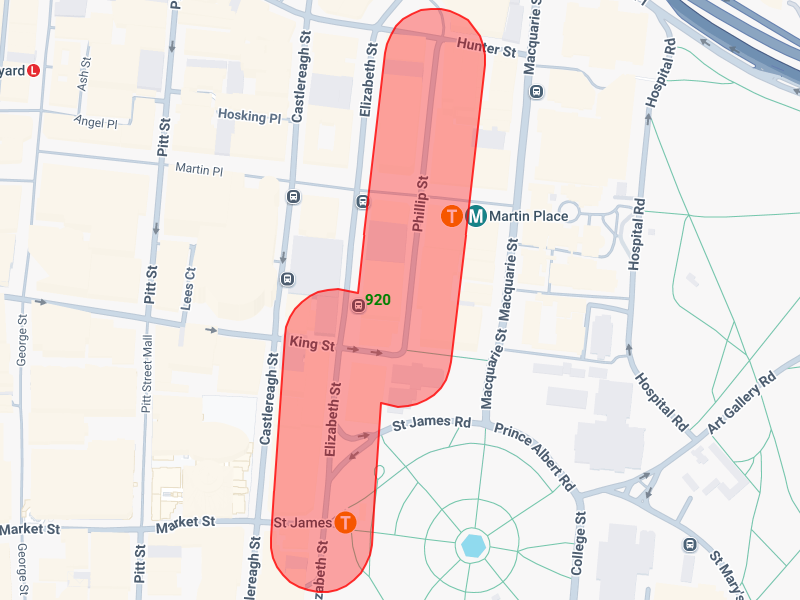
Map the corridor for transport, water, energy and other linear infrastructure to understand how communities change along the route.
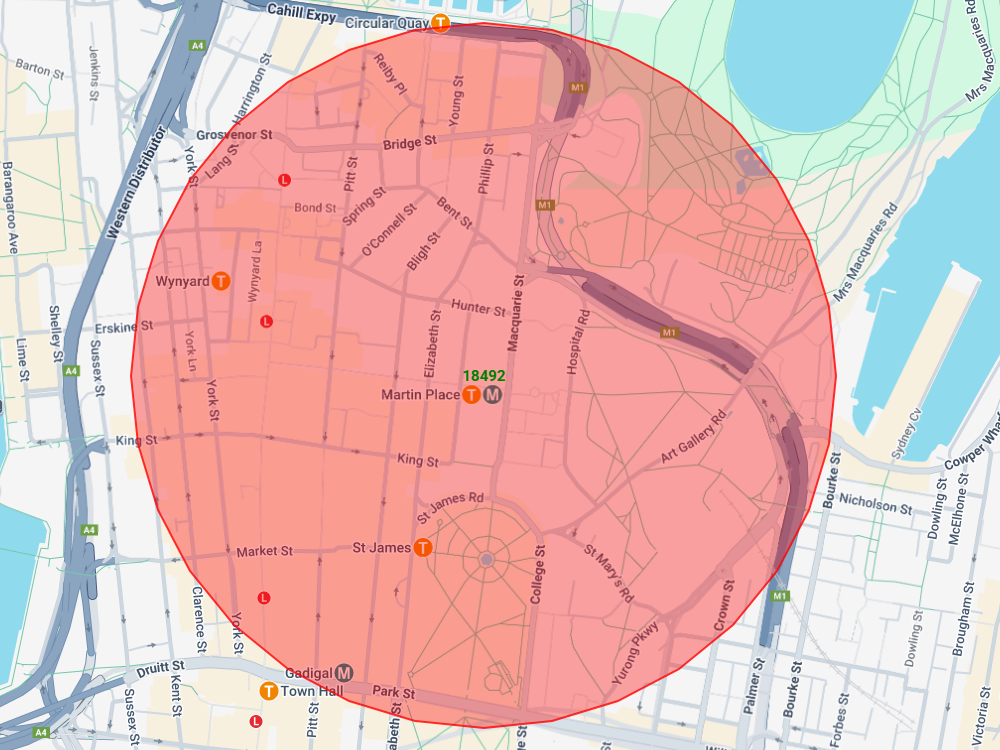
Understand the community around a transport hub
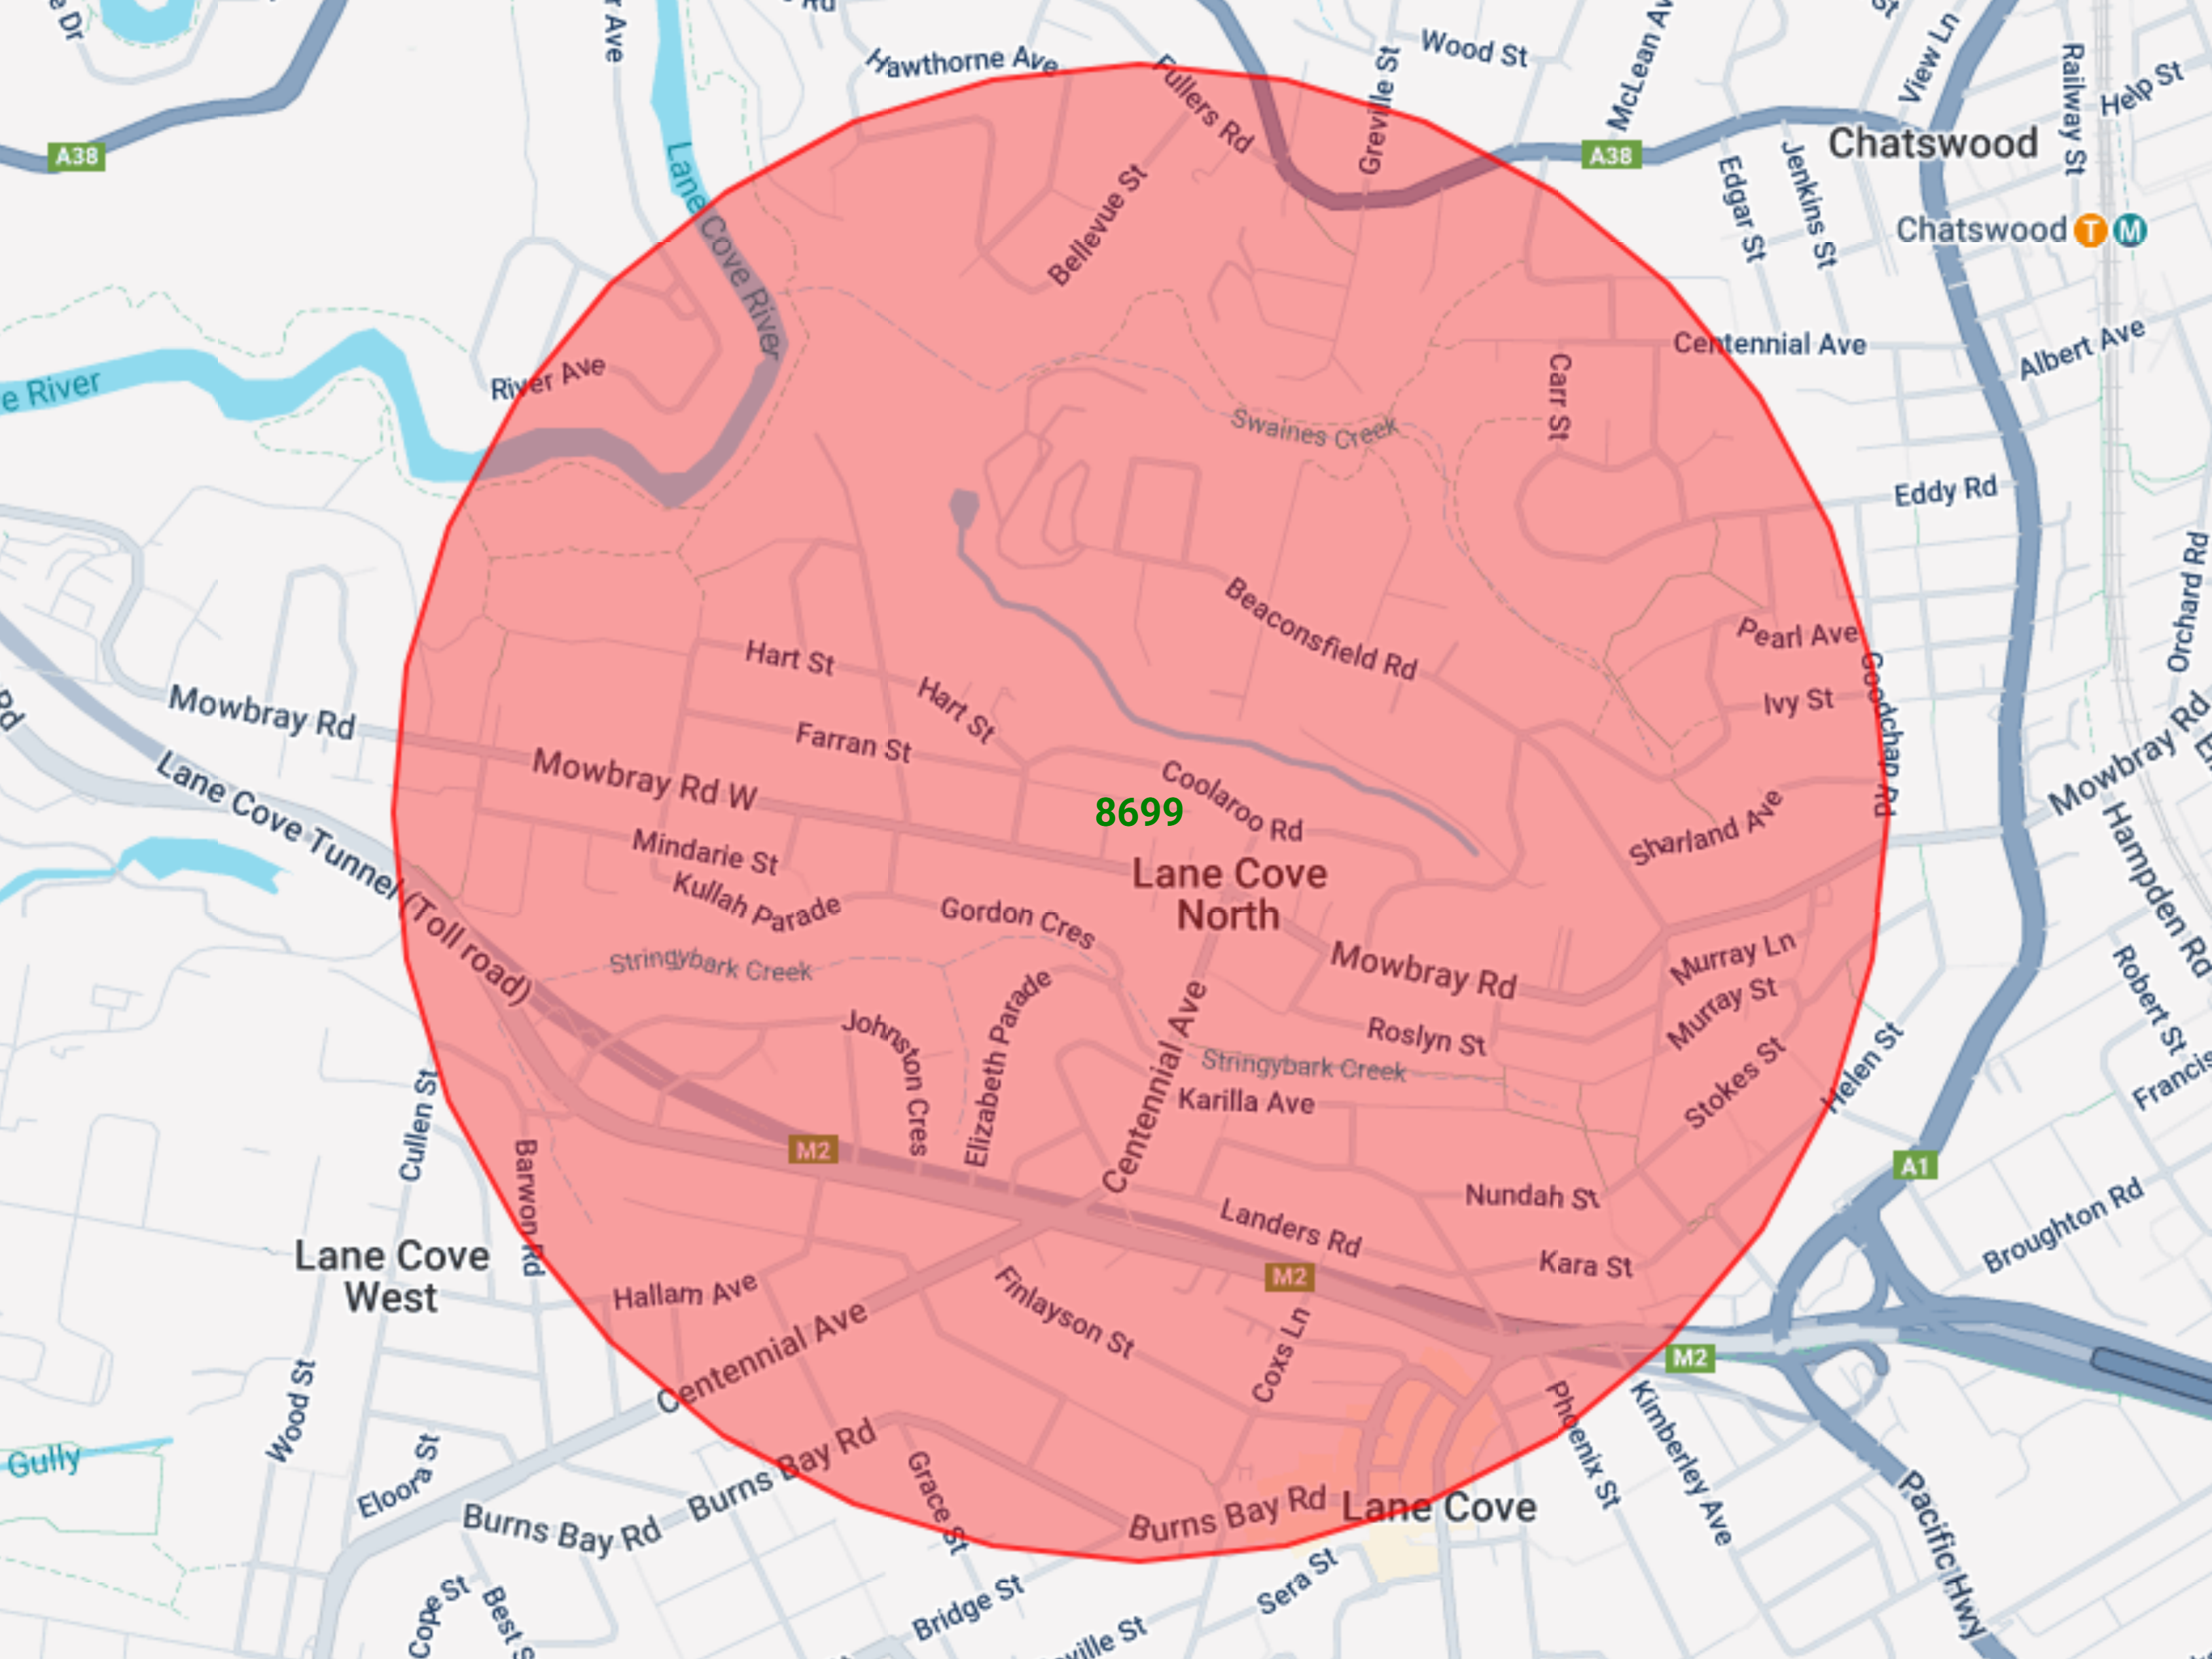
Draw a radius around a station or interchange to understand the people and properties within its catchment.
Put project impacts on the map
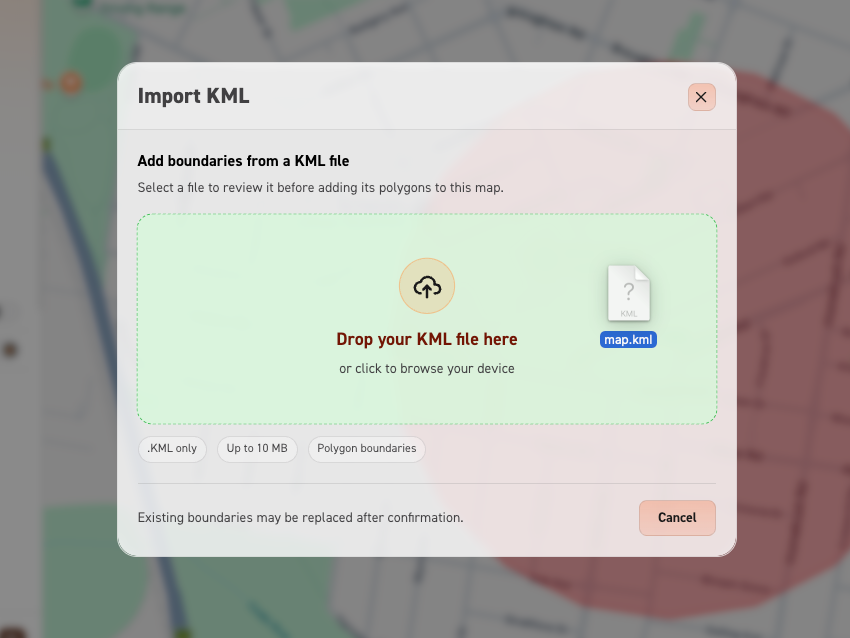
Import KML files to overlay project impacts and see which properties fall within construction noise zones, heritage boundaries or other affected areas.
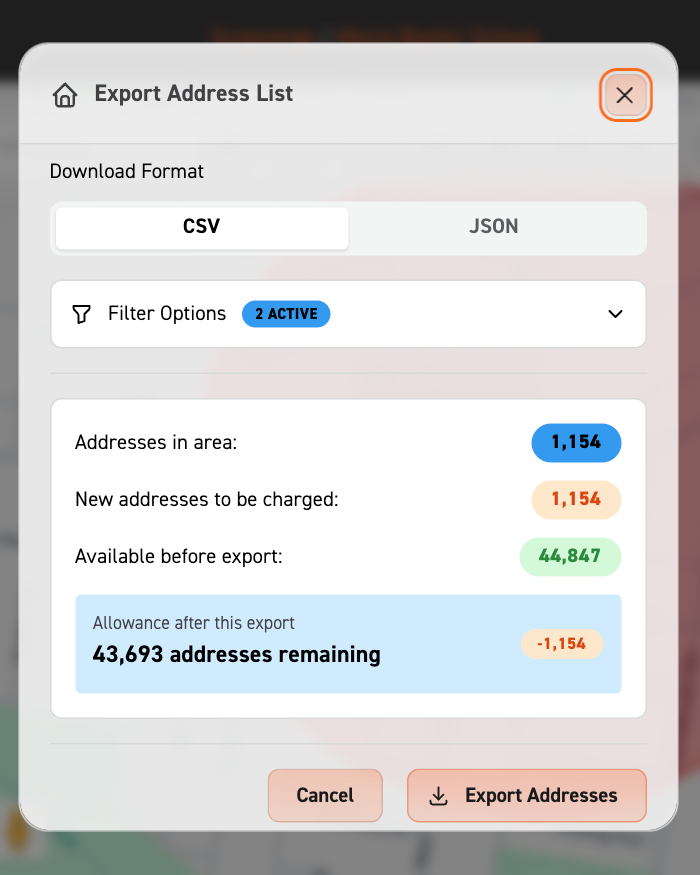
Get addresses to keep the community informed
Export residential and business addresses within your project area to plan notifications, mailouts and doorknocks.