Take the legwork out of social impact assessments
Get detailed ABS data for your exact study area, without the hours of data wrangling.
Data for your unique study area
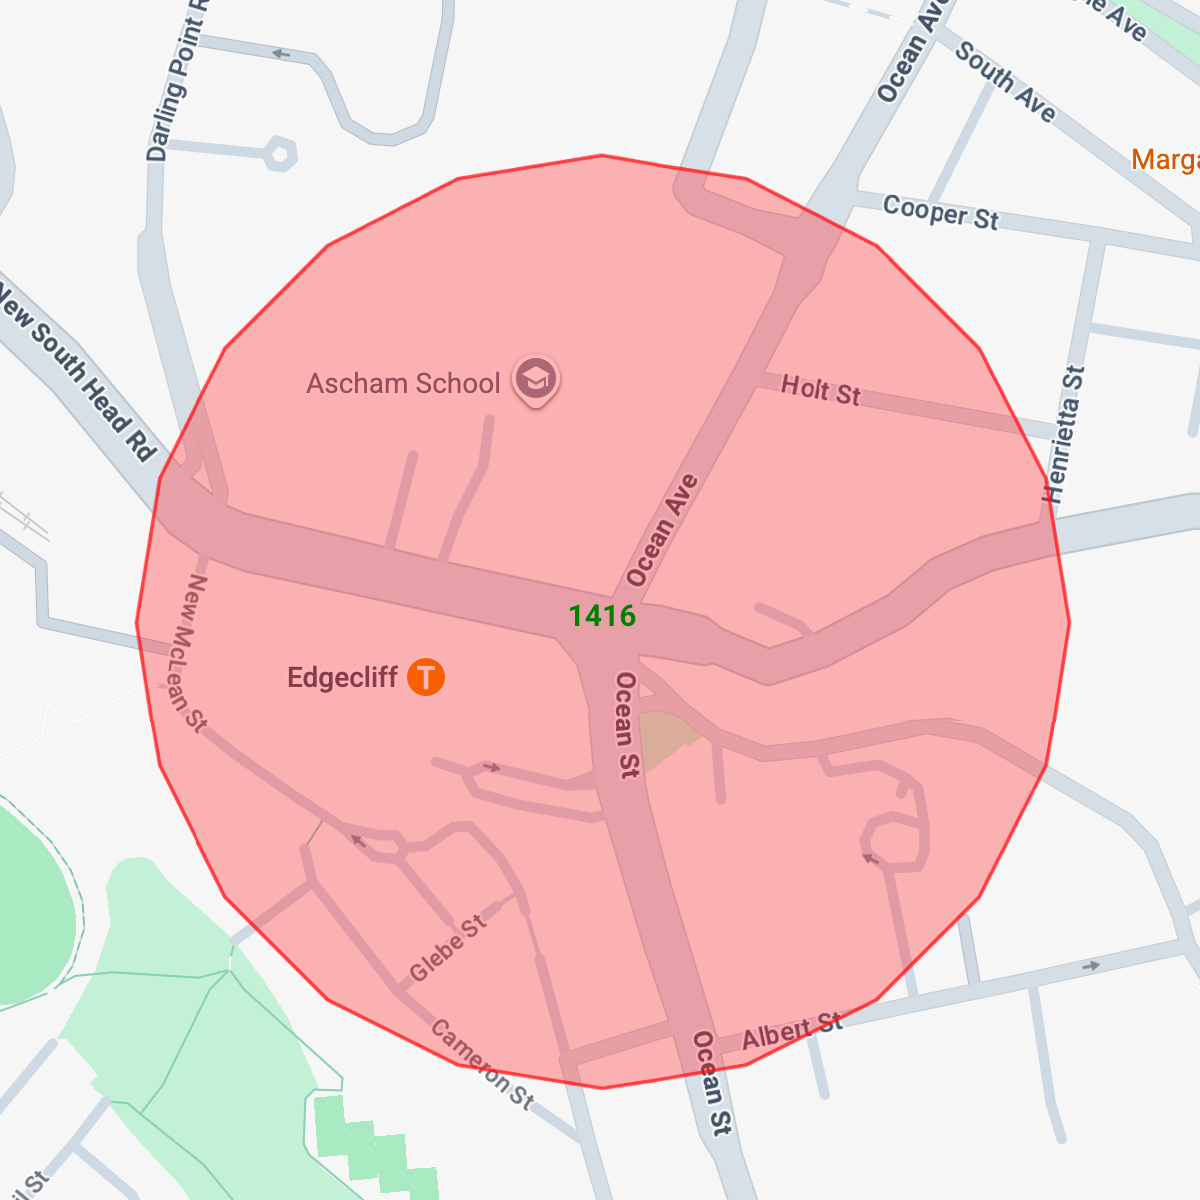
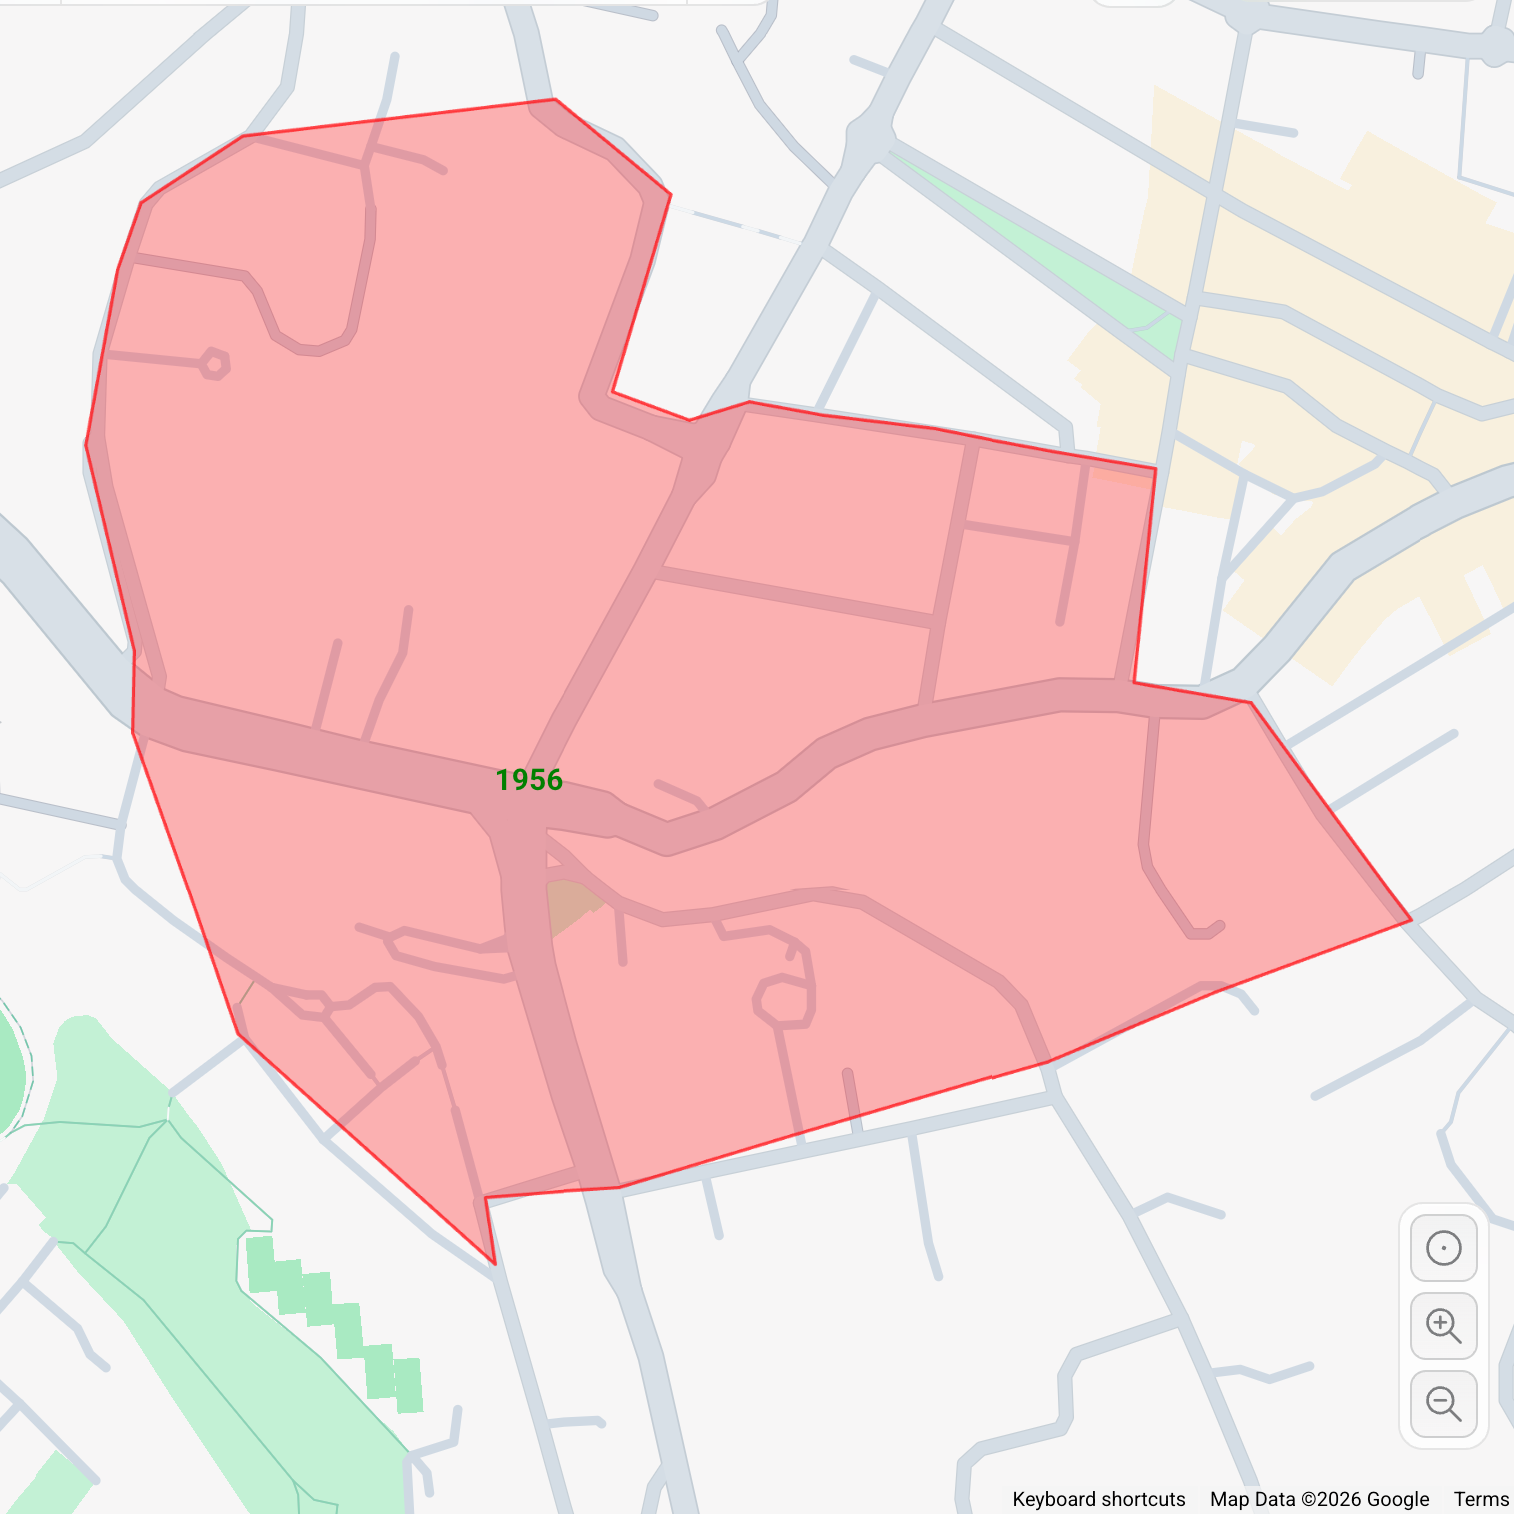
Draw your study area and Scopomap integrates data from multiple SA1 data sets. This gives you more accurate breakdowns than the preset SA1 datasets.
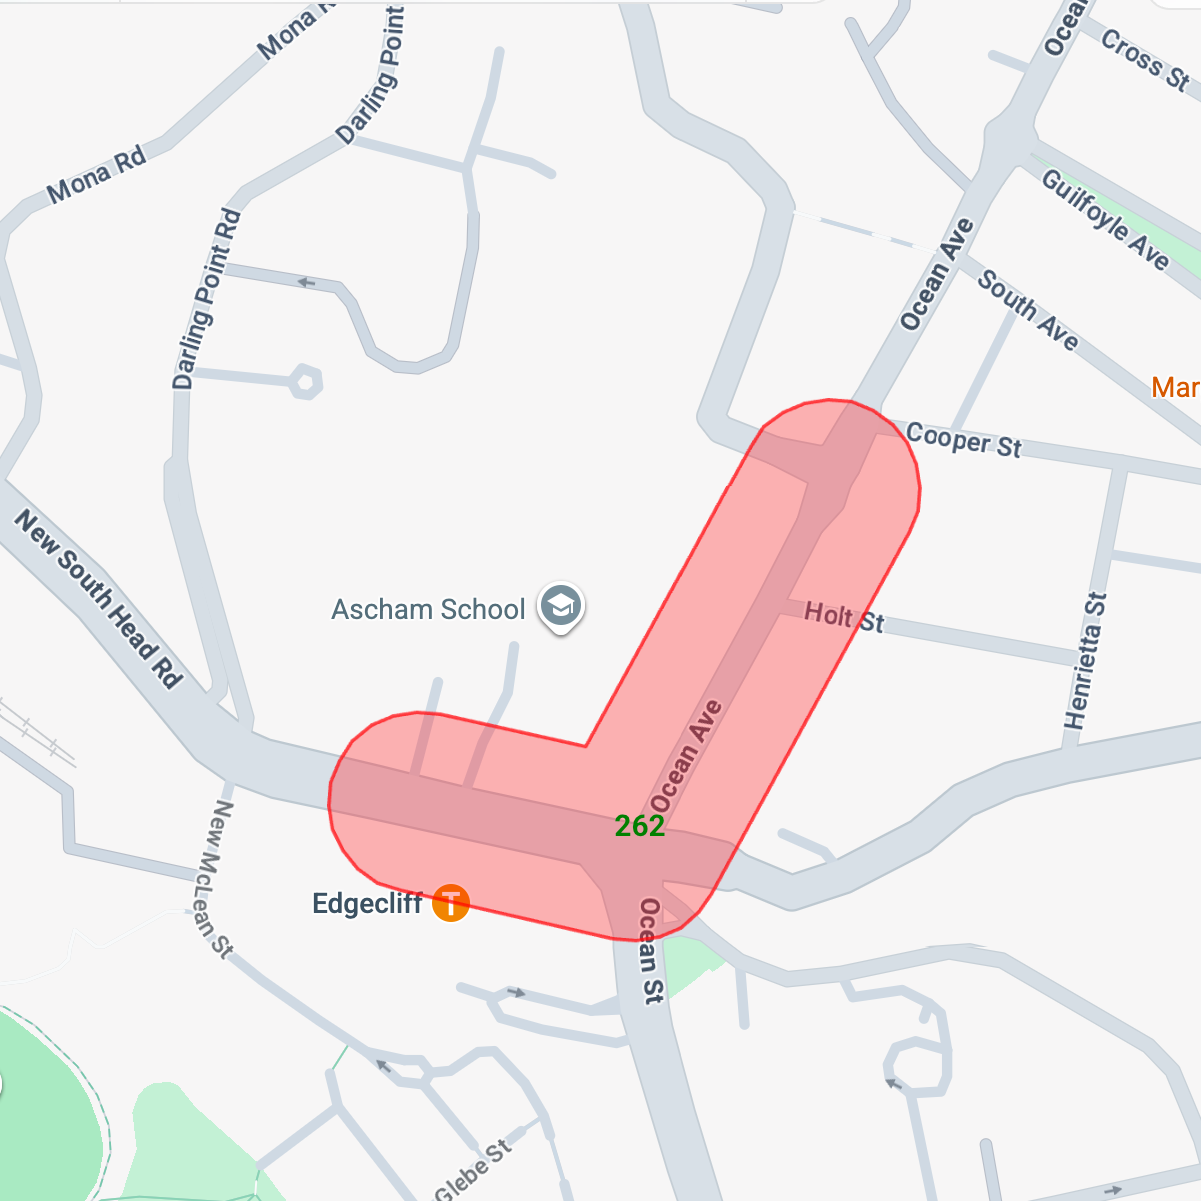
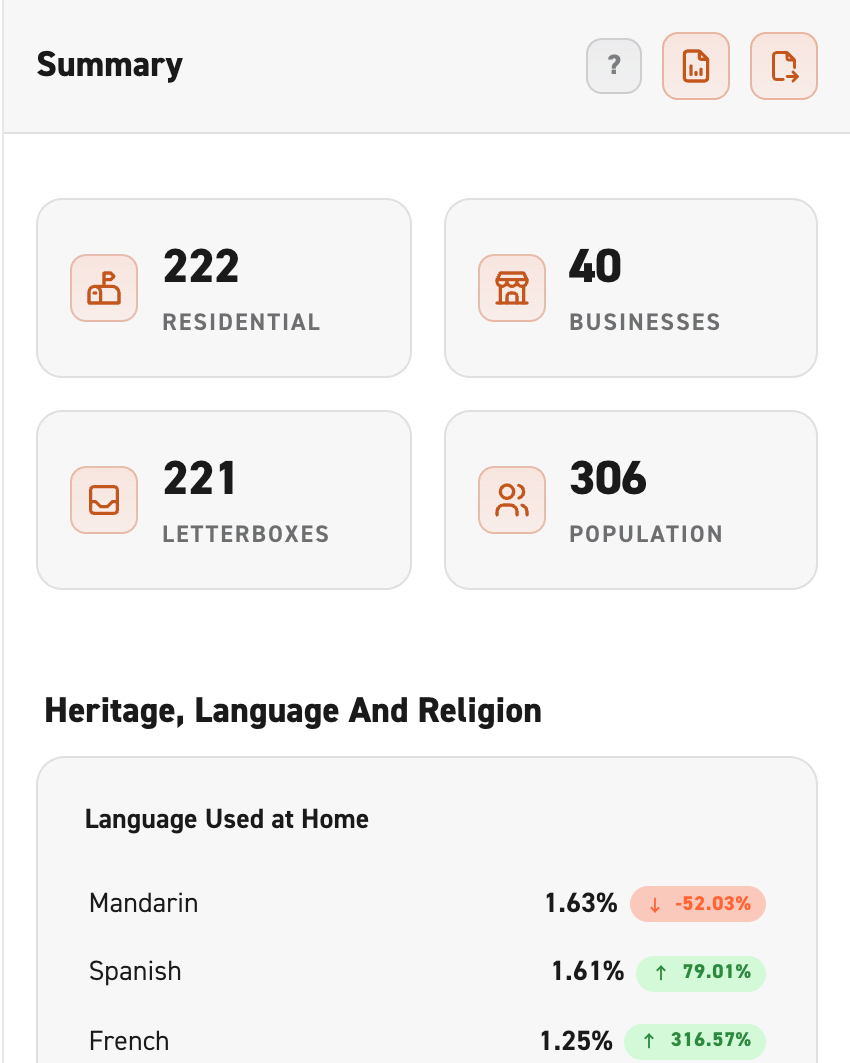
Build a baseline in minutes, not hours
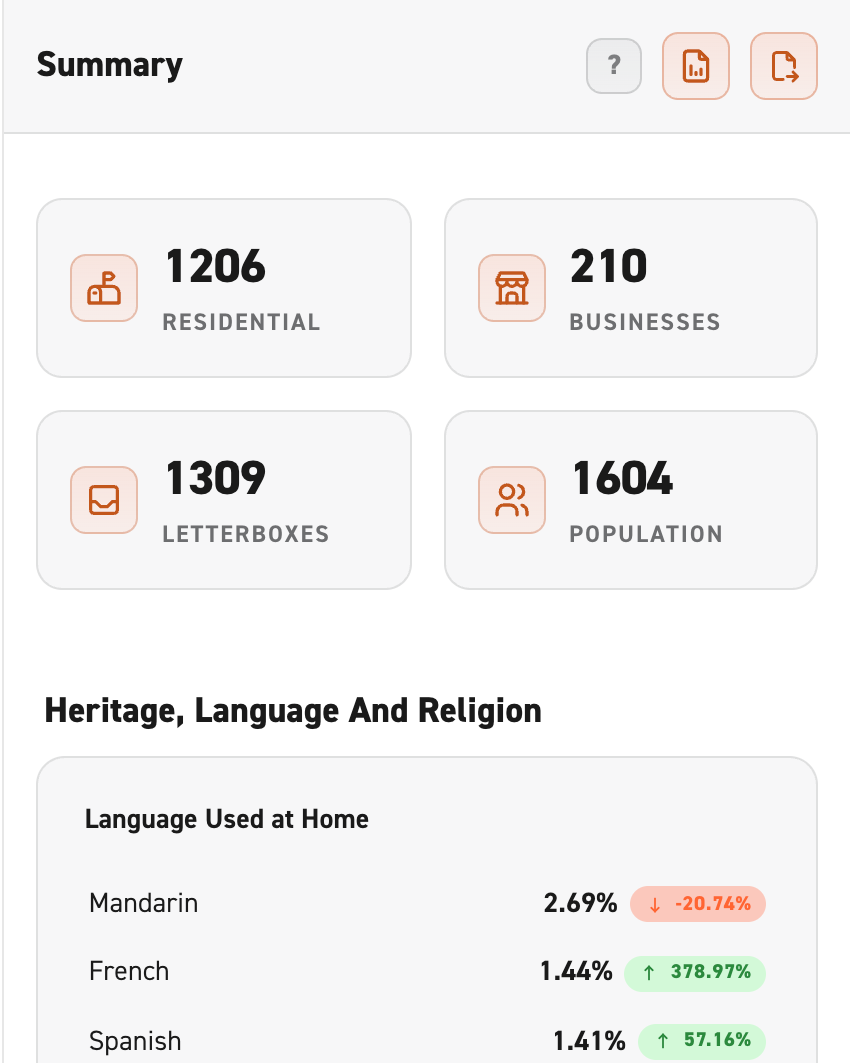
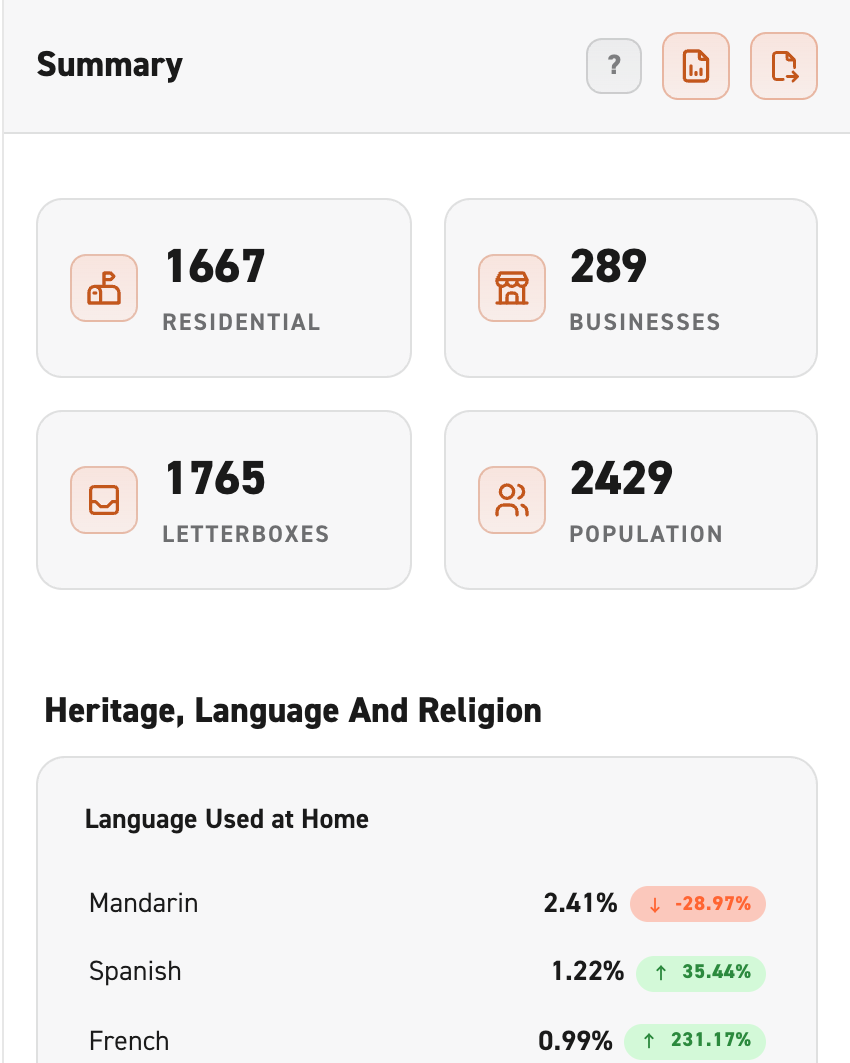
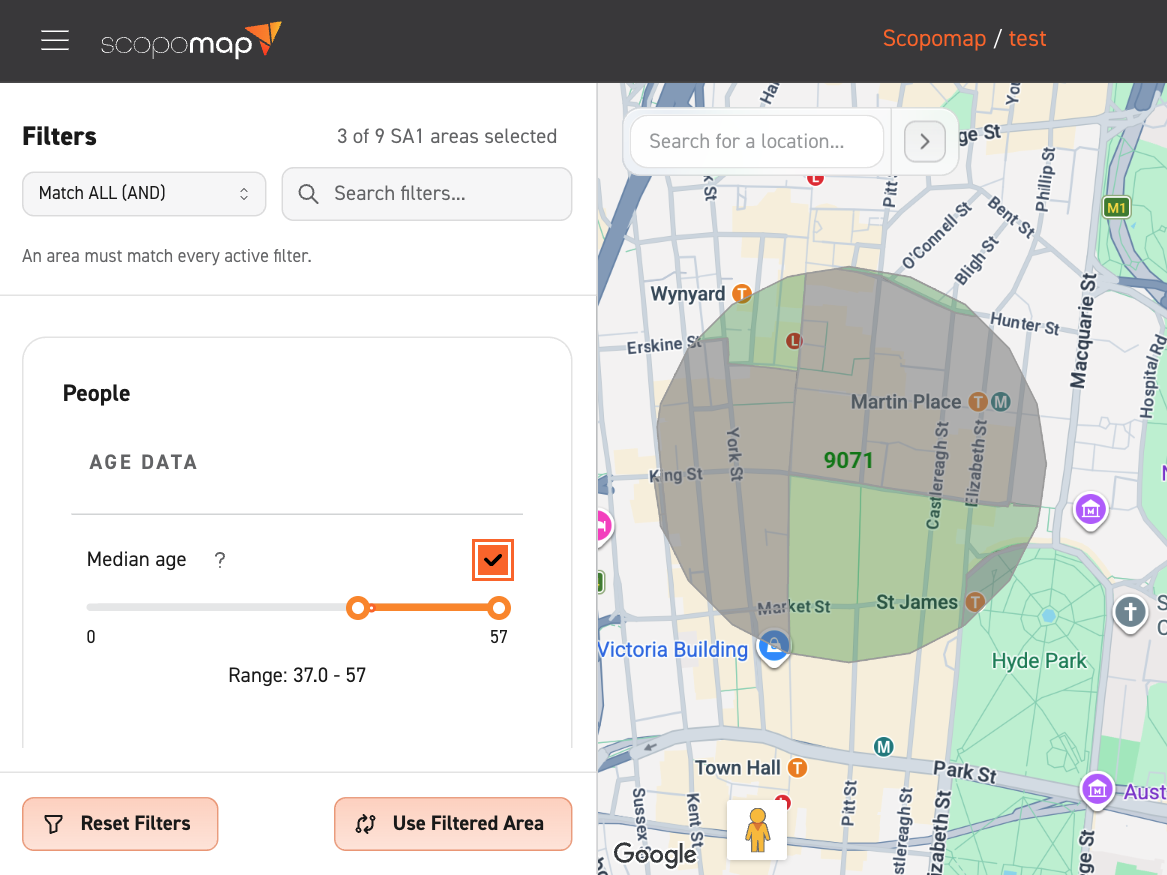
Select from over 170 ABS indicators to build a demographic baseline for your exact study area.
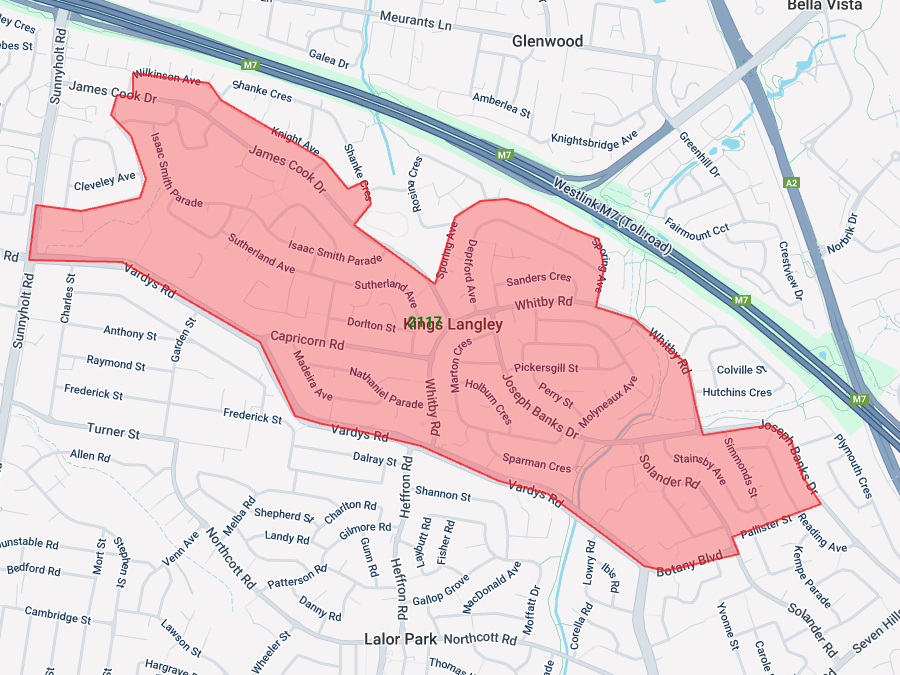
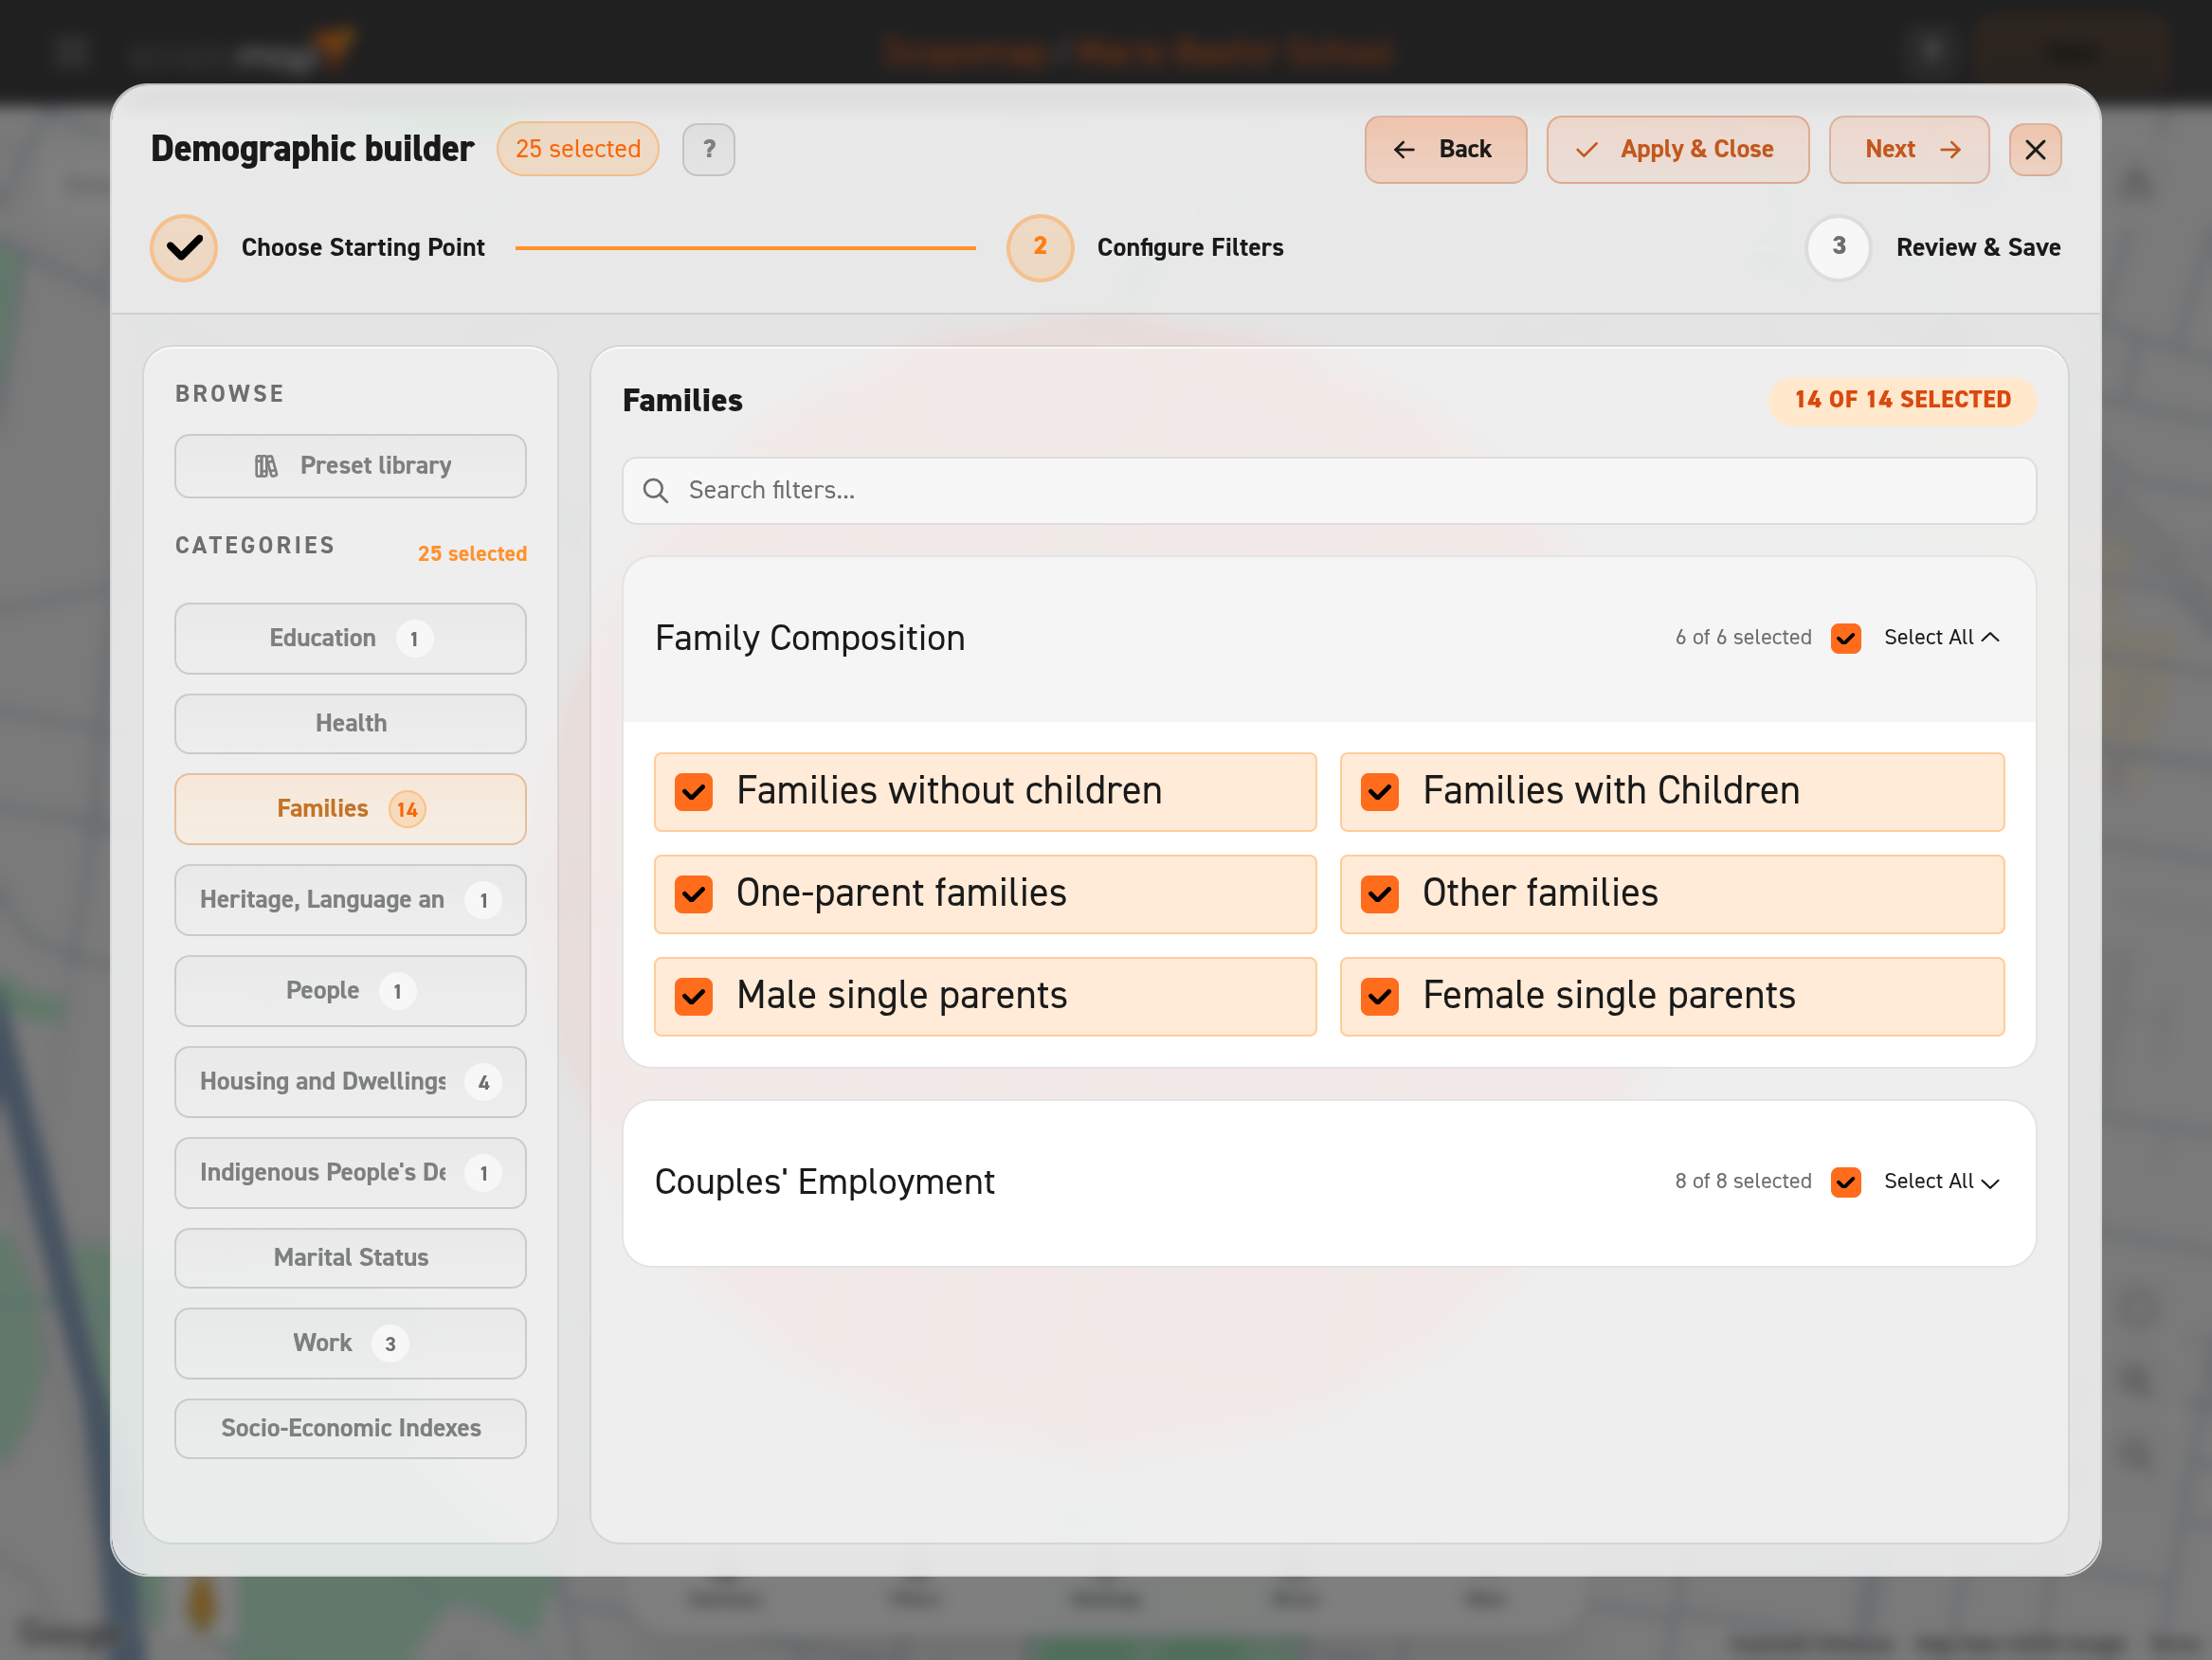
Identify affected and vulnerable groups
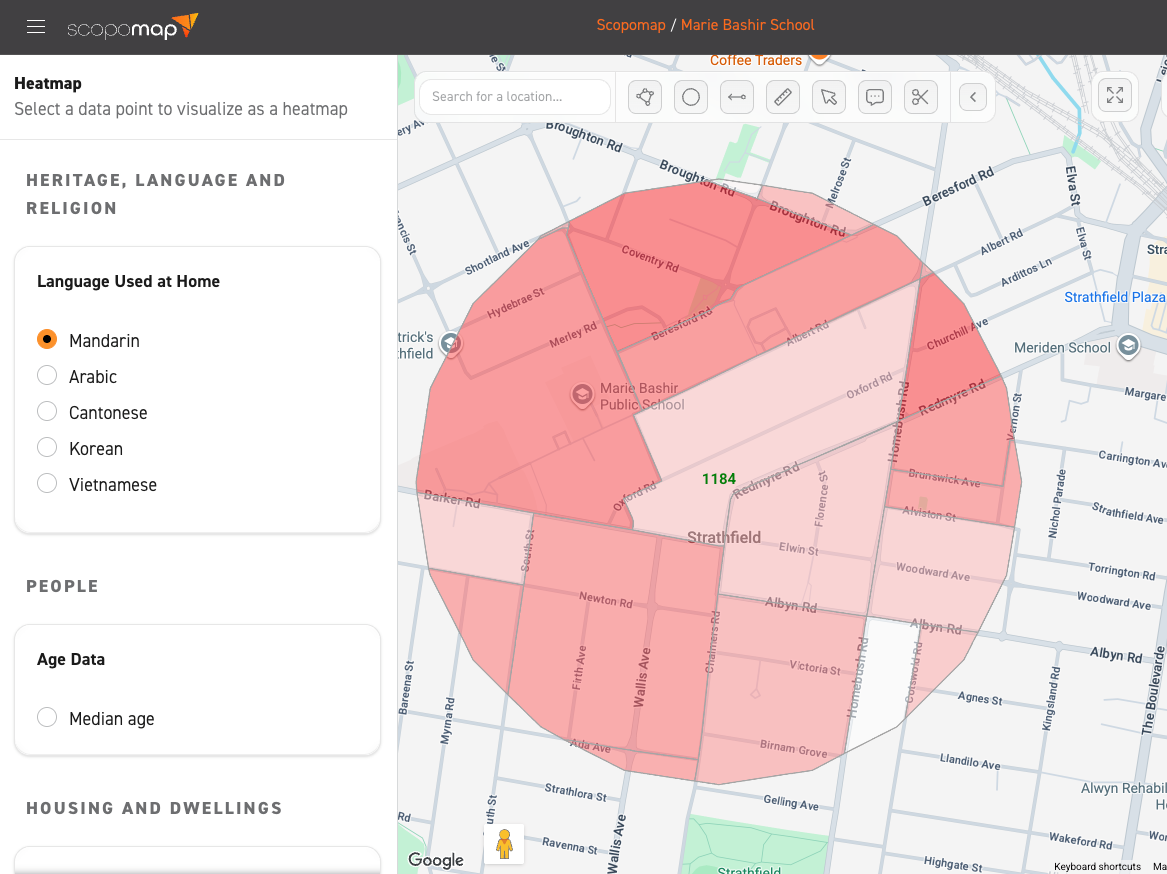
See the hidden demographic patterns within a catchment, including pockets of disadvantage.
Export data into your spreadsheet
Interrogate the demographics of your unique catchment by exporting the data into one spreadsheet (CSV). No more wrestling with complicated ABS tools.
Item
Area
State Average
National Average
Units
Residential dwellings
181
Businesses
6
Letterboxes
187
Population
546
Preschool
2.29
6.8
6.3
%
Primary - total
21.03
26.5
27
%
Secondary - total
17.65
20.9
21.2
%
Tertiary - total
33.17
23.8
23.3
%