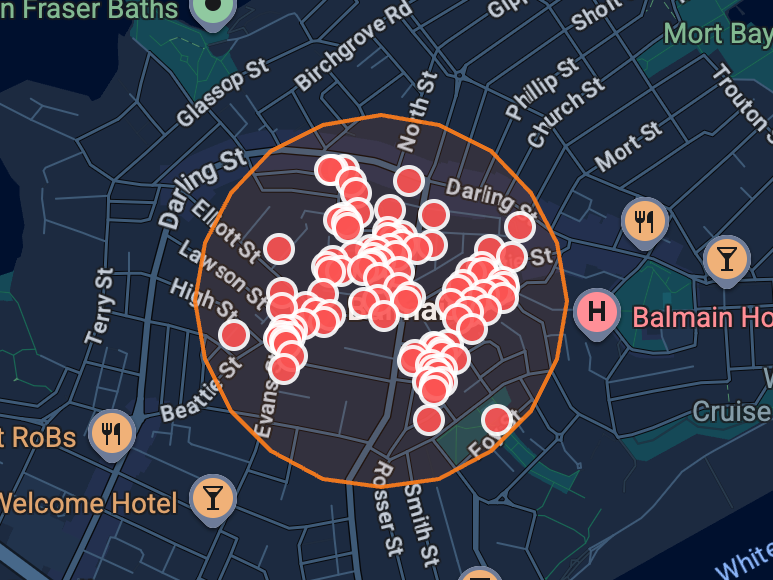
Community data matched to your planning area
Understand the community within your exact planning area, so you're not relying on suburb-wide generalisations.
Evidence matched to your planning area
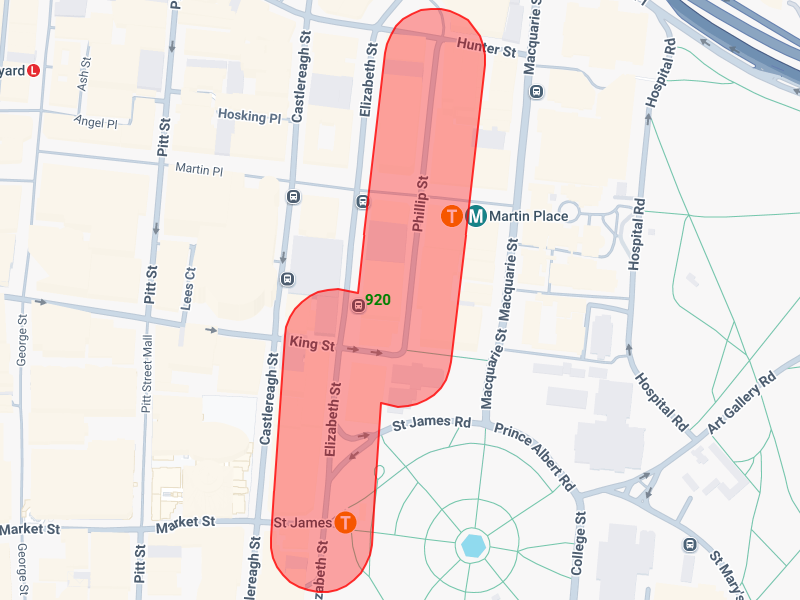
Draw your precinct, catchment or corridor and get aggregated demographic data from multiple SA1 data sets.
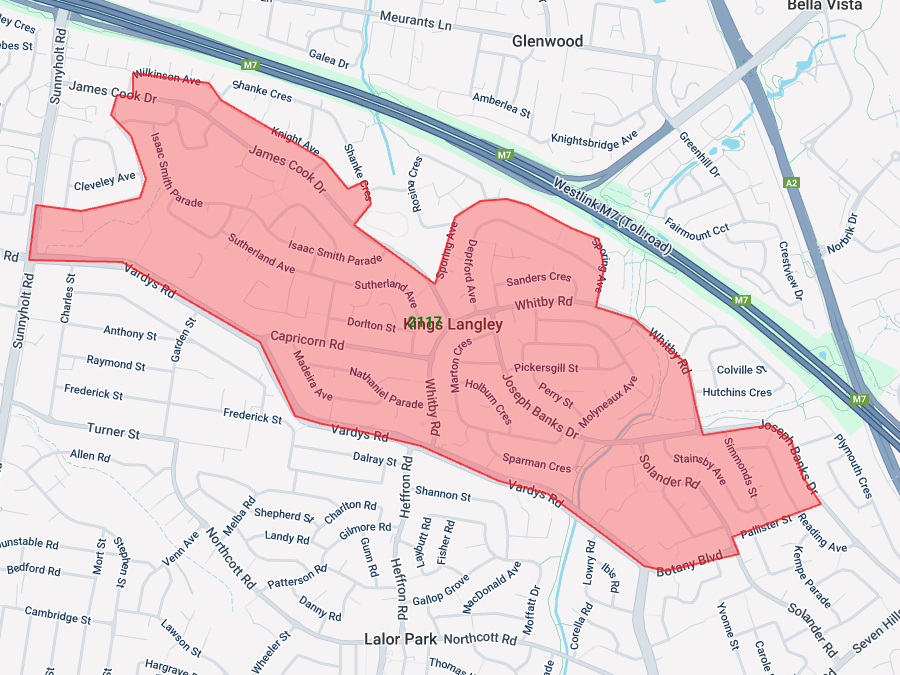
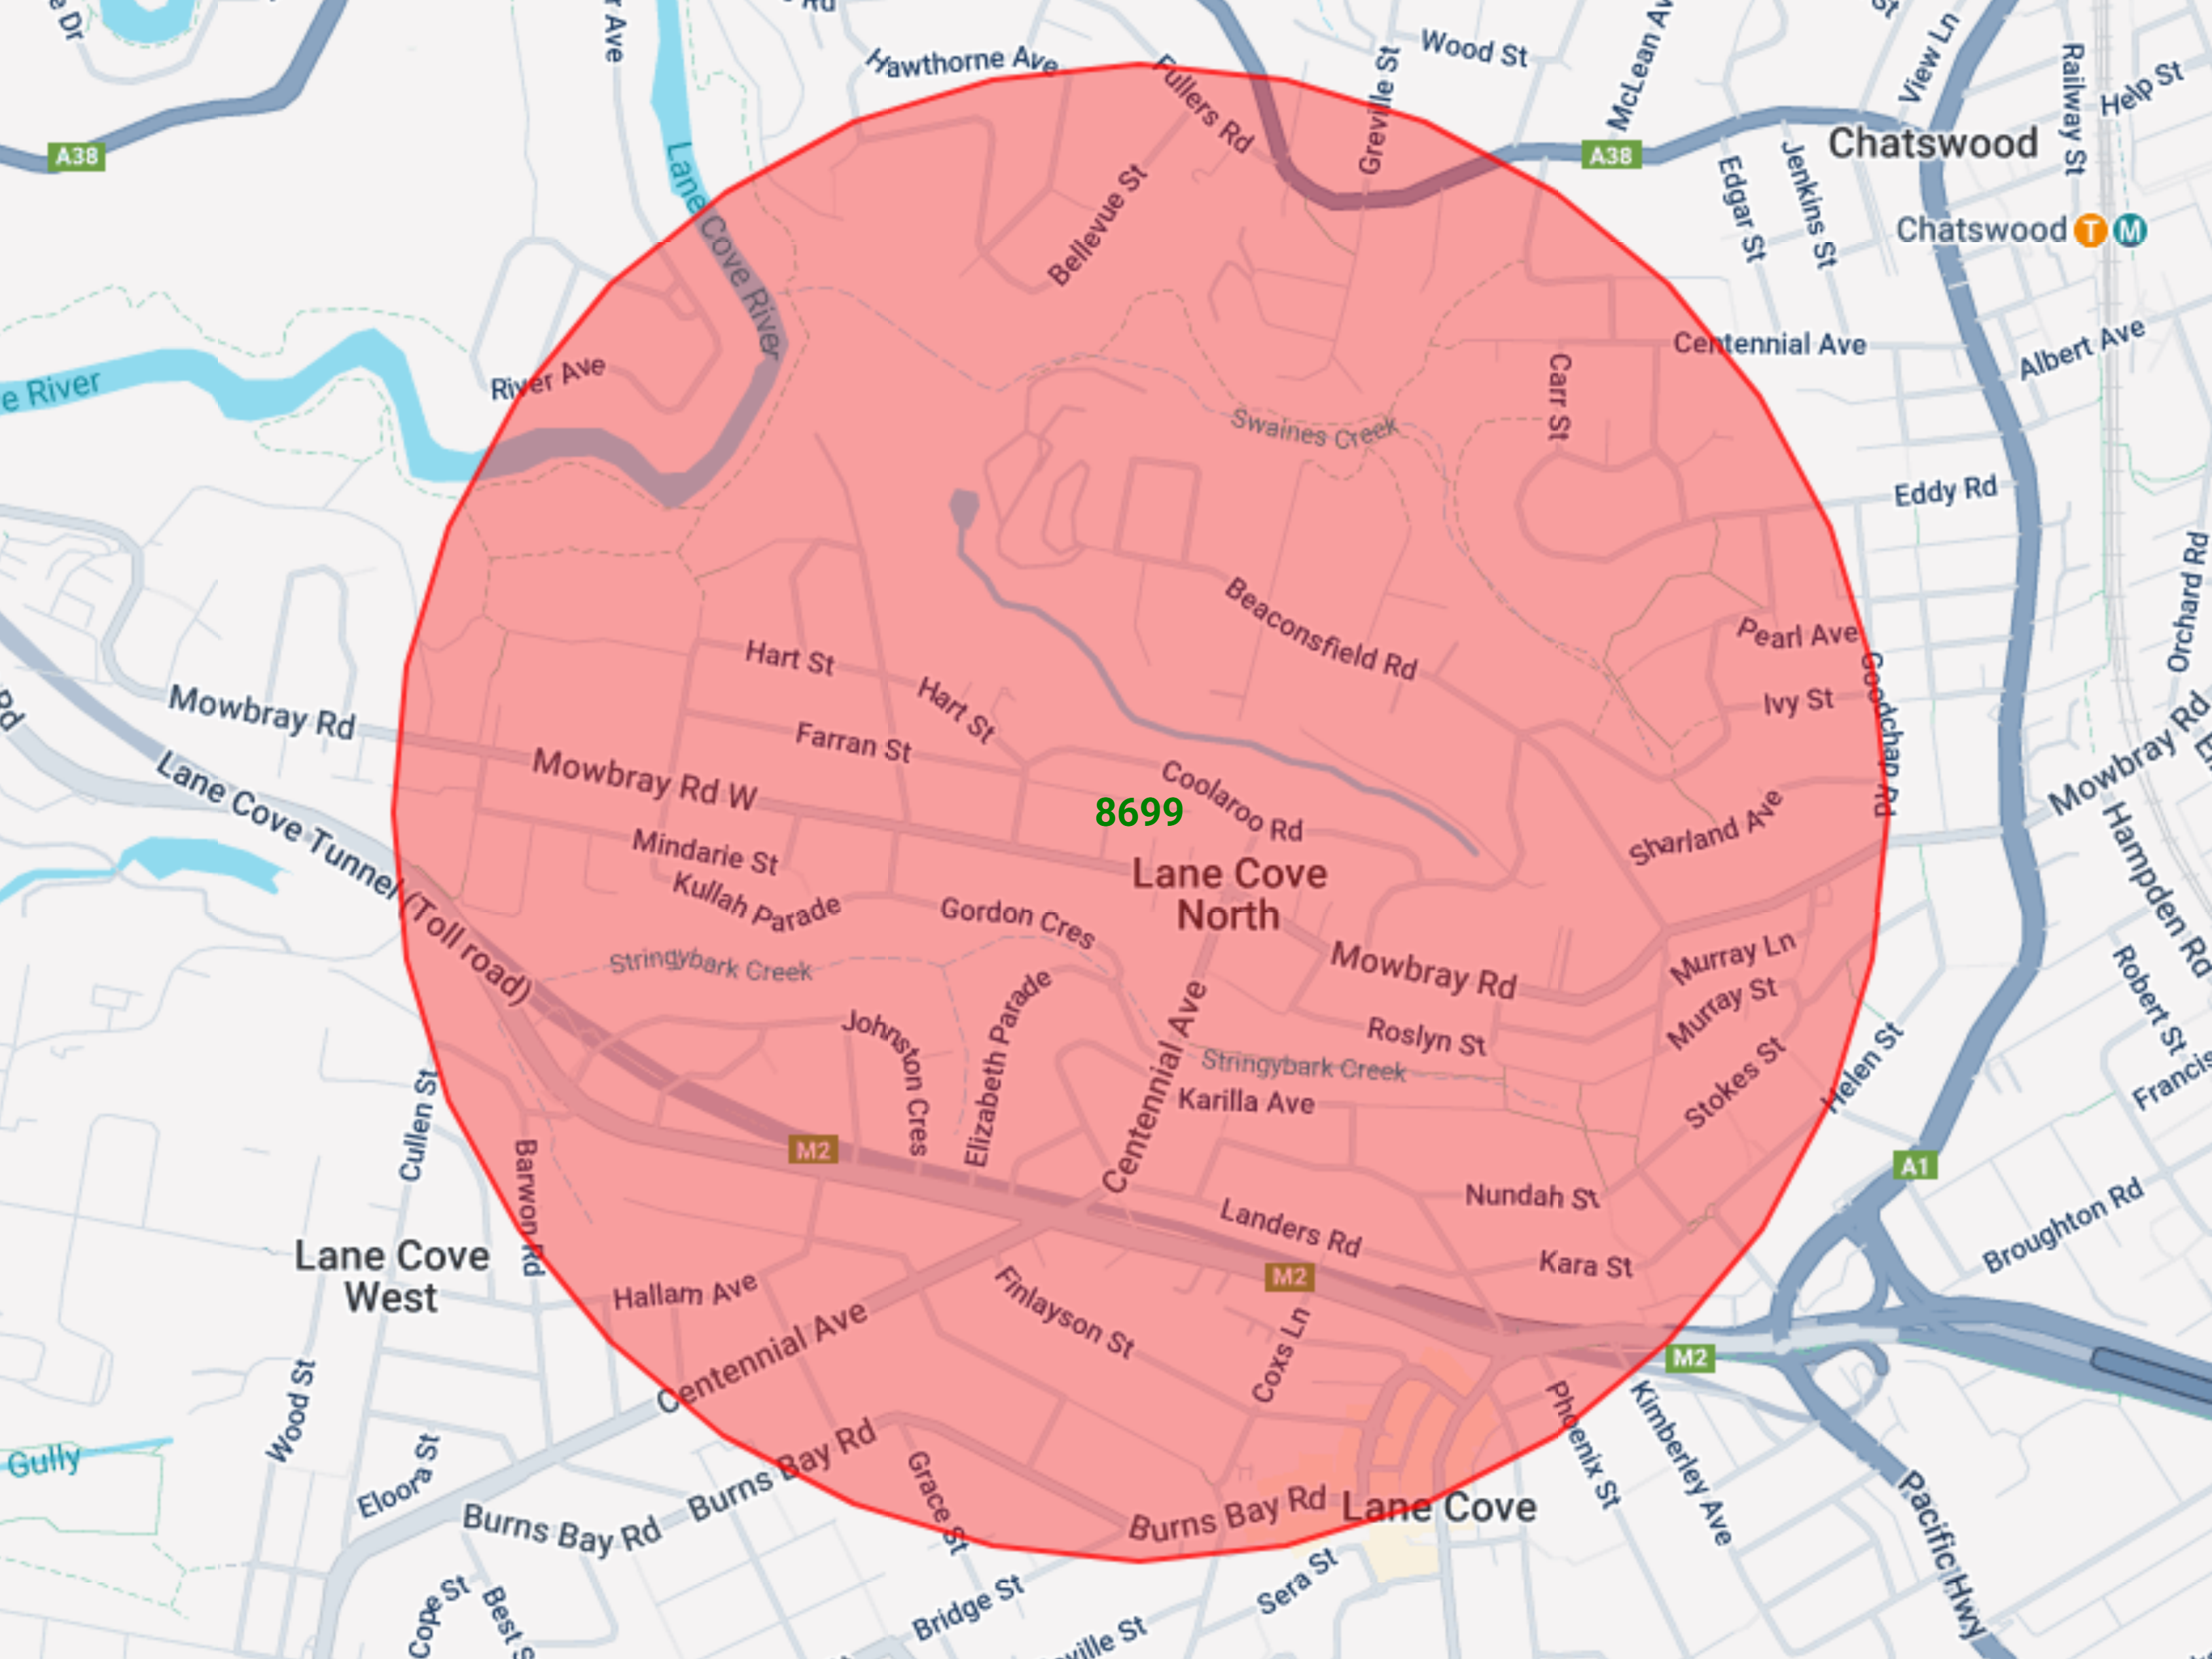
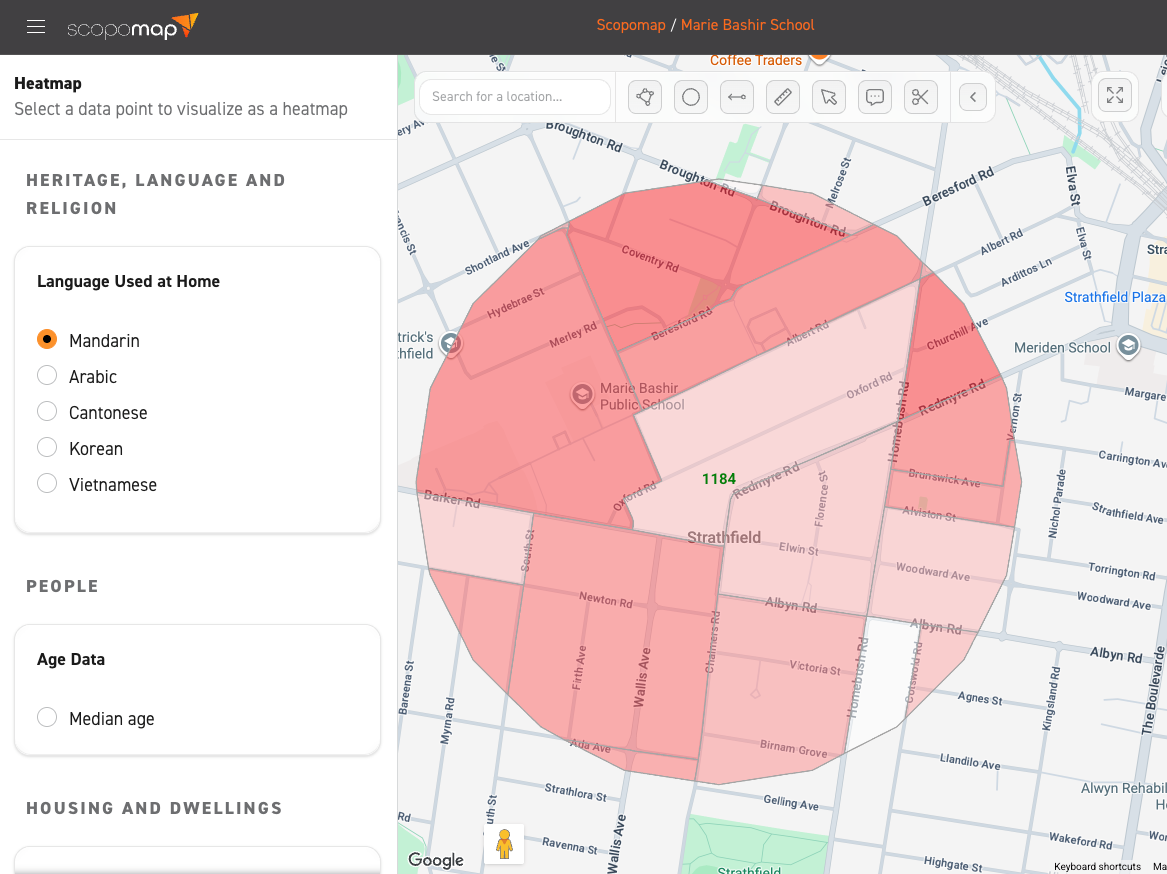
See the variation across your planning area
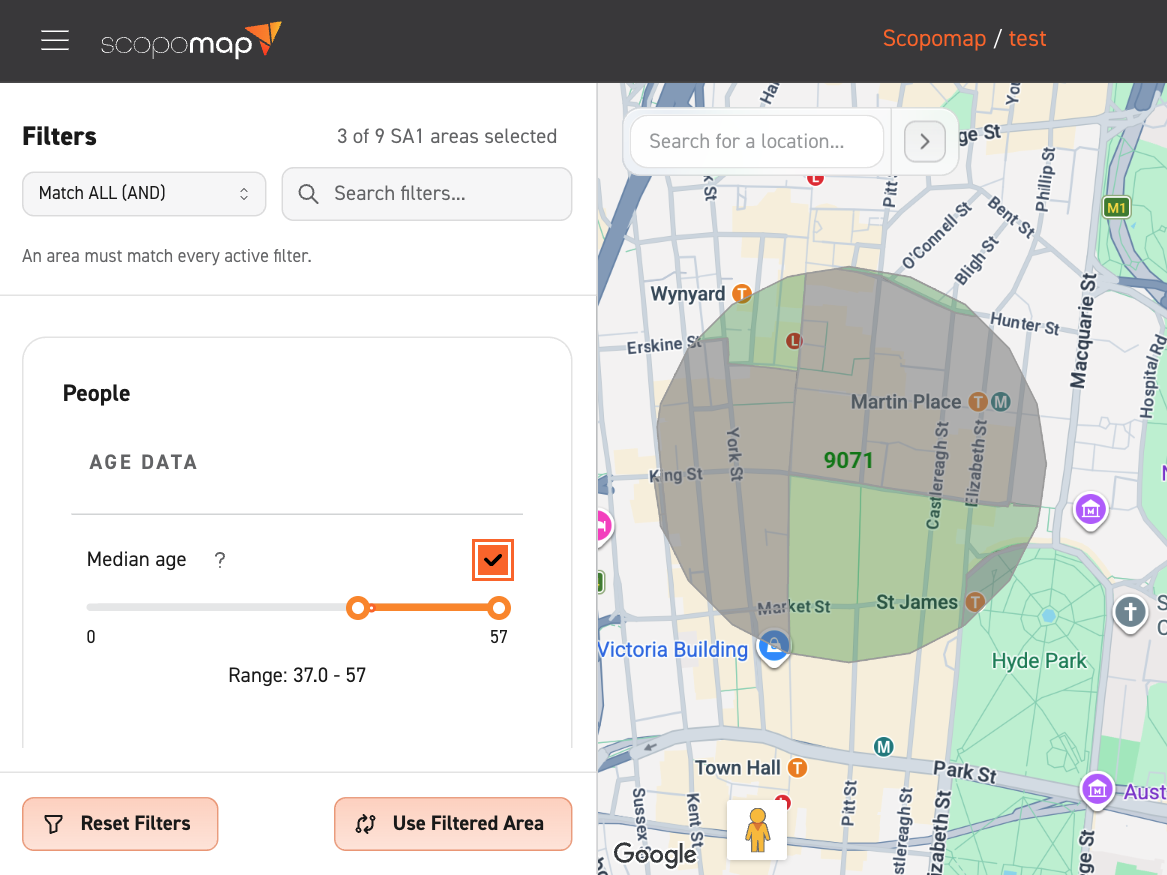
See where different groups are concentrated across your planning area, such as age groups, renters and homeowners, income levels and cultural groups.
Plan for transport-oriented development
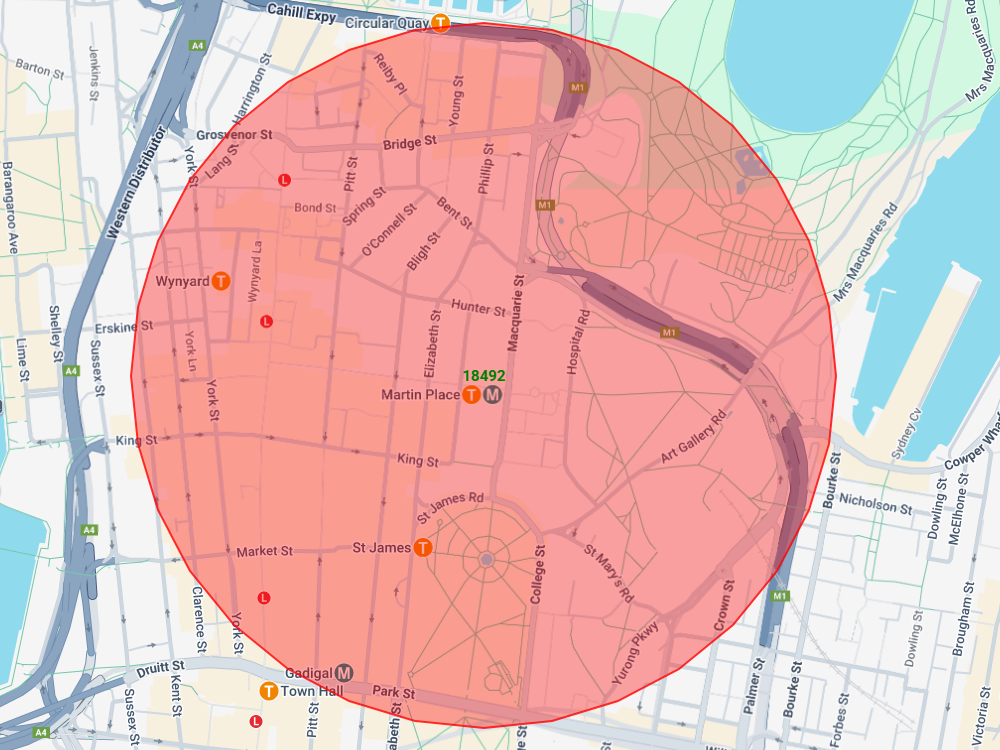
Draw a walking catchment around a station or interchange and understand the people and properties affected by increased density.
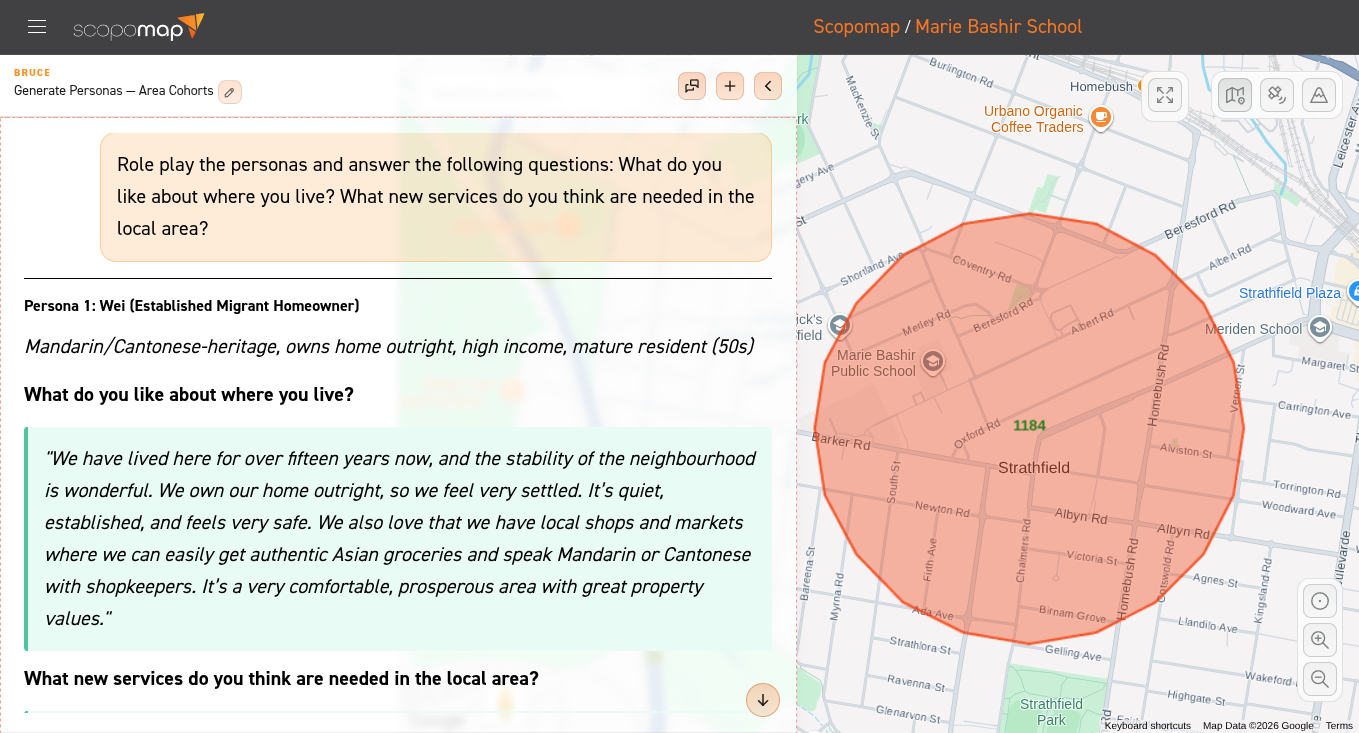
Test your proposal before exhibition
Use representative AI personas from your planning area to test questions and identify issues to investigate before formal consultation.
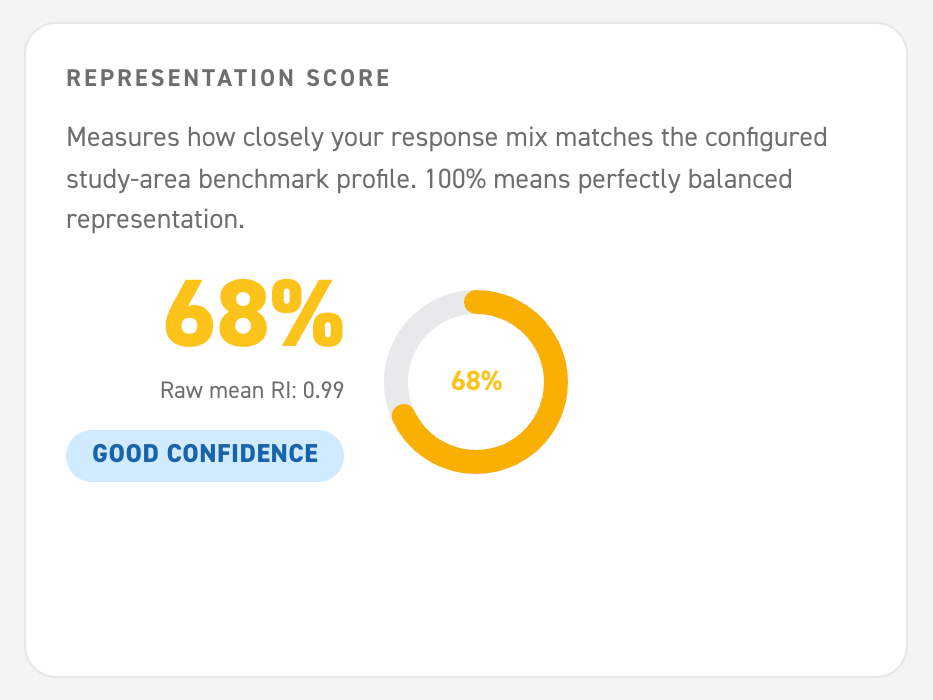
See who you're hearing from during exhibition
Create online surveys linked to your planning area and identify whether support or opposition is broadly shared across the community.